Energy Attribution with Factry Historian
Introduction
In this document, we will describe how to set up a dashboard for energy attribution on the level of a batch. We will do so using the Faketory demo datasetFaketory demo dataset.
For the energy attribution use case, we will build a basic dashboard showing the following metrics:
- An overview of recent mixing batches, with energy usage per batch
- A detailed view of subbatches (process steps) of the selected batch
- Energy usage per recipe
To make the dashboard dynamic, we will also add a variable to select a specific line and batch.
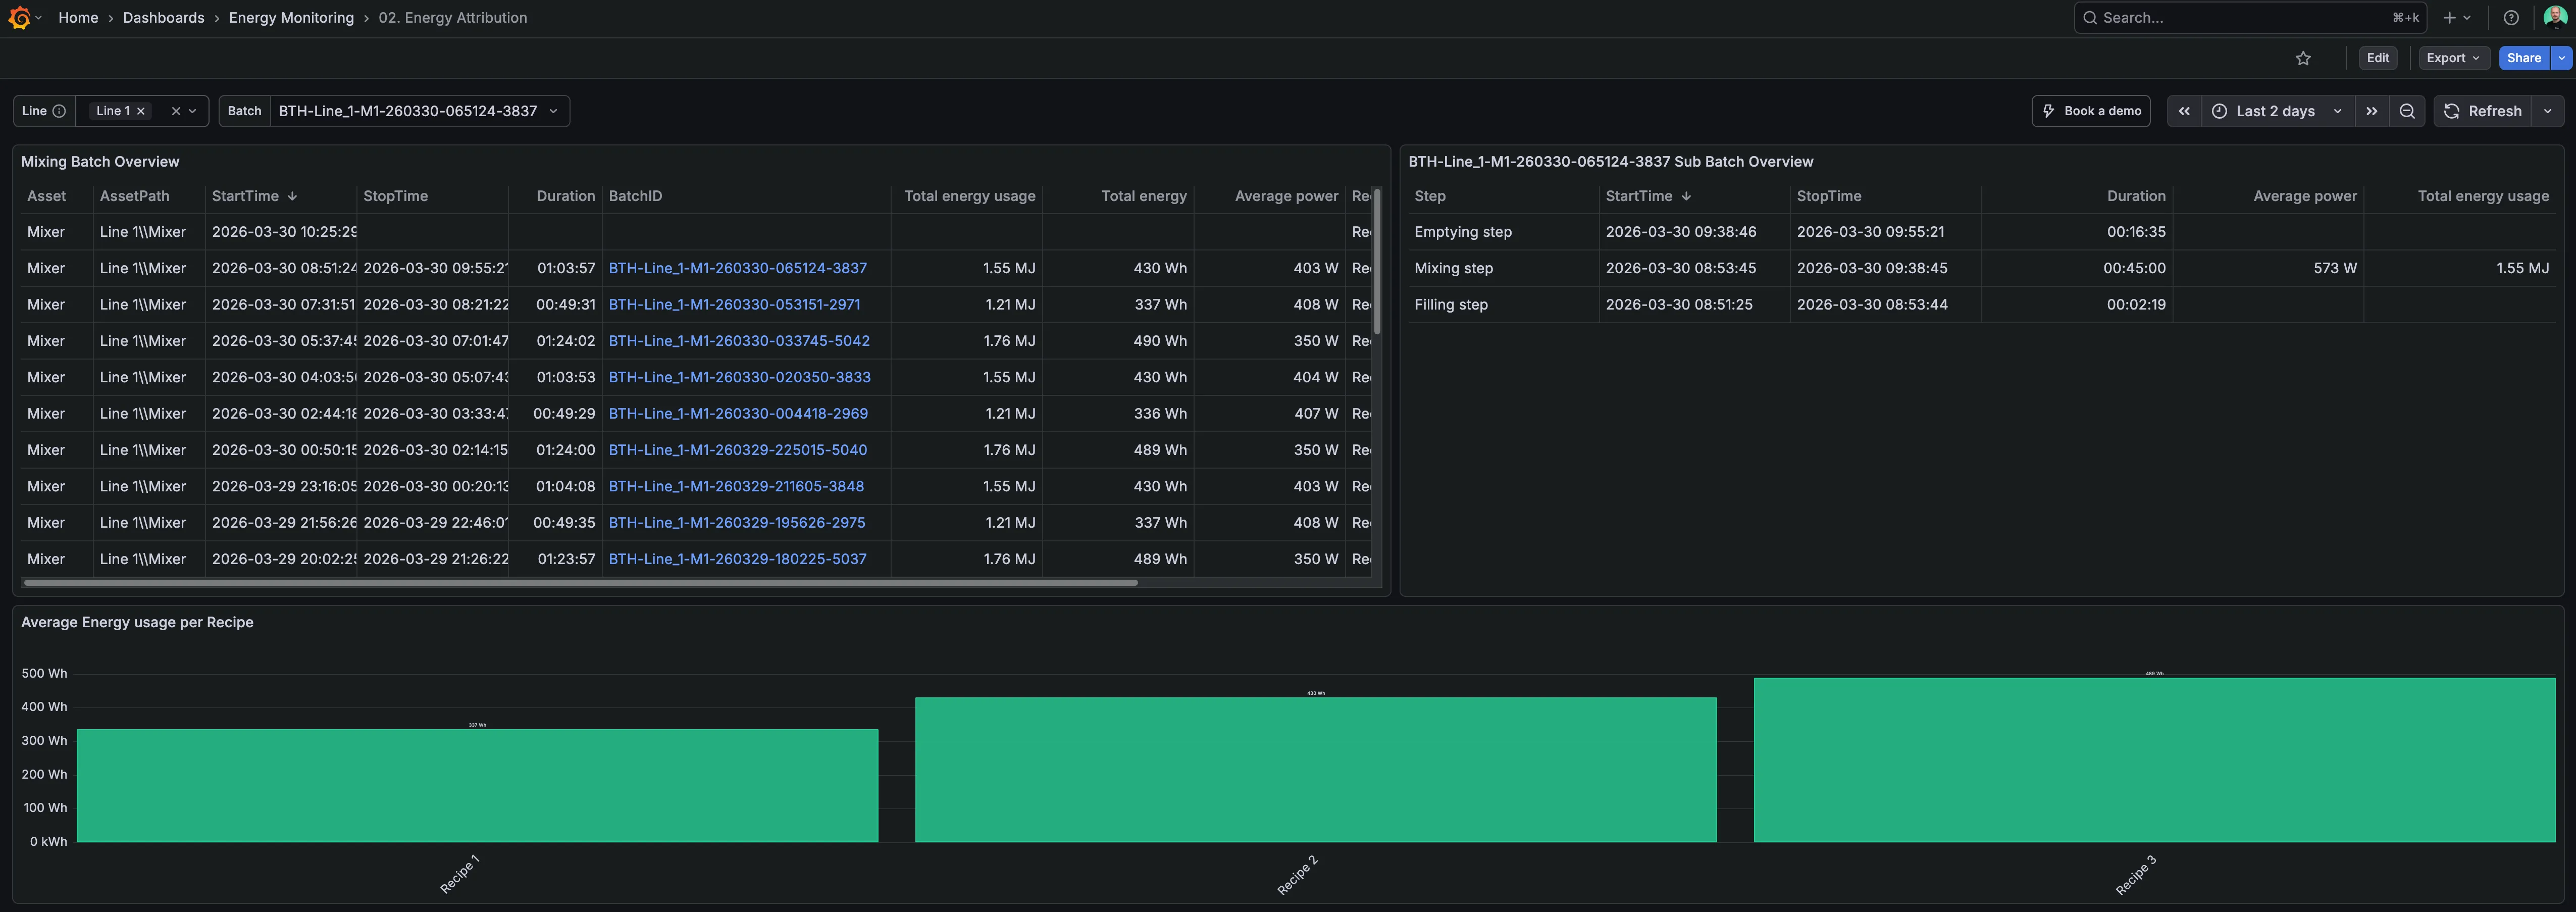
You can see the end result of this dashboard on the Factry demo environment.
Prerequisites
Consult the prerequisites of Energy Monitoring & Attribution.
Building a Grafana dashboard
Create a new dashboard
Start by creating a new dashboard in Grafana.
Configuring the dashboard variables
In the newly created dashboard, navigate to Settings > Variables. Click + New variable. Then, configure the new variable as follows:
- Variable type: Custom
- General:
- Name: line
- Label: Line
- Description: Select the appropriate line from the dropdown menu.
- Hide: Nothing
- Custom Options:
- Values separated by comma: Line 1,Line 2
- Selection options:
- Select Multi-value.
Next, configure an additional variable:
- Variable type: Query
- General:
- Name: batch
- Label: Batch
- Query options:
- Data source: select the Factry Historian Datasource
- Query type: Simple
- Assets: /${line:regex}\\\\Mixer/
- Event types: Mixing Batch
- Property: BatchID
Then, click Save dashboard and give your dashboard a fitting name e.g. Energy Attribution.
Adding the Mixing Batch Overview
Click Add > Visualization. Then, select the Factry Historian datasource.
In the Queries tab, query A, select the Events tab, then configure the following:
- Query type: Simple
- Assets: /${line:regex}\\\\Mixer/
- Event types: Mixing Batch
Then, in the Transformations tab, add the following transformations. Click + Add transformation and select:
- Series to rows
- Organize fields by name (click the eye icon to clean up some default fields returned by the datasource).
Now, slide open the Visualization selection on the right. Select the Table visualization and configure the following options:
- Panel options:
- Title: Mixing Batch Overview
- Table:
- Show table header
- Now, copy your dashboard URL and click + Add field override and configure it:
- Fields with name: BatchID
- + Add override property:
- Data link:
- Title: View details
- URL: Paste your dashboard URL and append the following GET parameter: &var-batch=${__data.fields.BatchID}.
Click Back to dashboard and resize your table to fit the top left.
Adding the Sub Batch Overview
Click Add > Visualization. Then, select the Factry Historian datasource.
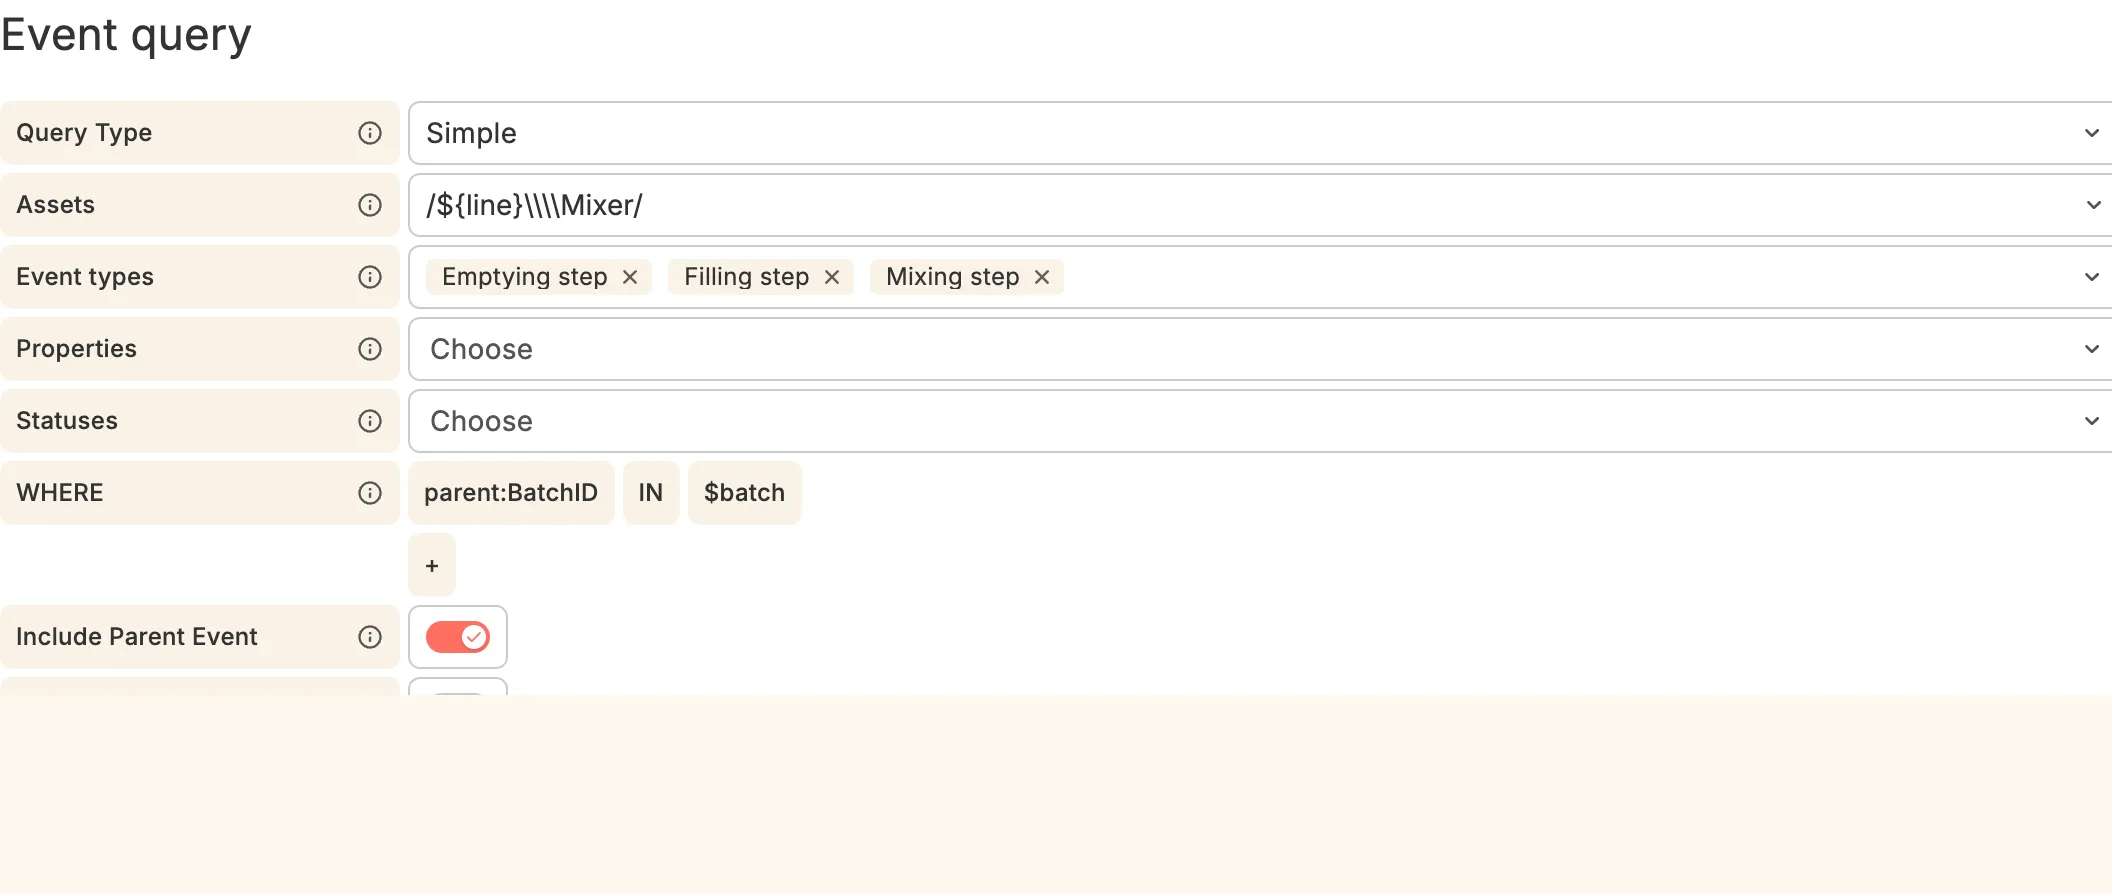
In the Queries tab, query A, select the Events tab, then configure the following:
- Query type: Simple
- Assets: /${line:regex}\\\\Mixer/
- Event types: Emptying step, Filling step, Mixing step
- WHERE: parent:BatchID IN $batch
- Toggle Include Parent Event.
Then, in the Transformations tab, add the following transformations. Click + Add transformation and select:
- Series to rows
- Organize fields by name (click the eye icon to clean up some default fields returned by the datasource).
Now, slide open the Visualization selection on the right. Select the Table visualization and configure the following options:
- Panel options:
- Title: ${batch} Sub Batch Overview
- Table:
- Show table header
Click Back to dashboard and resize your table to fit the top right.
Adding Energy usage per Recipe
In the final panel, we will compare the average energy consumption per Recipe over the select dashboard timerange.
To keep our queries performant, we will reuse data from the Mixing Batch Overview panel and use transformations to shape our data.
Click Add > Visualization. Then, select Dashboard as the data source. Select the following:
- Source panel: Mixing Batch Overview
- Data: All data
- Transform: Off
- AdHocFilter: Off
Then, go to the Transformations tab and select the following transformations:
- Group by:
- Total energy (kWh): Mean
- Recipe: Group by
- Sort by
- Field: Recipe
Slide open the Visualization selection on the right and select the Bar chart type. Configure the following:
- Panel options:
- Title: Energy usage per Recipe
- Bar chart:
- X Axis: Recipe
- Rotate x-axis tick labels: -45°
End Result
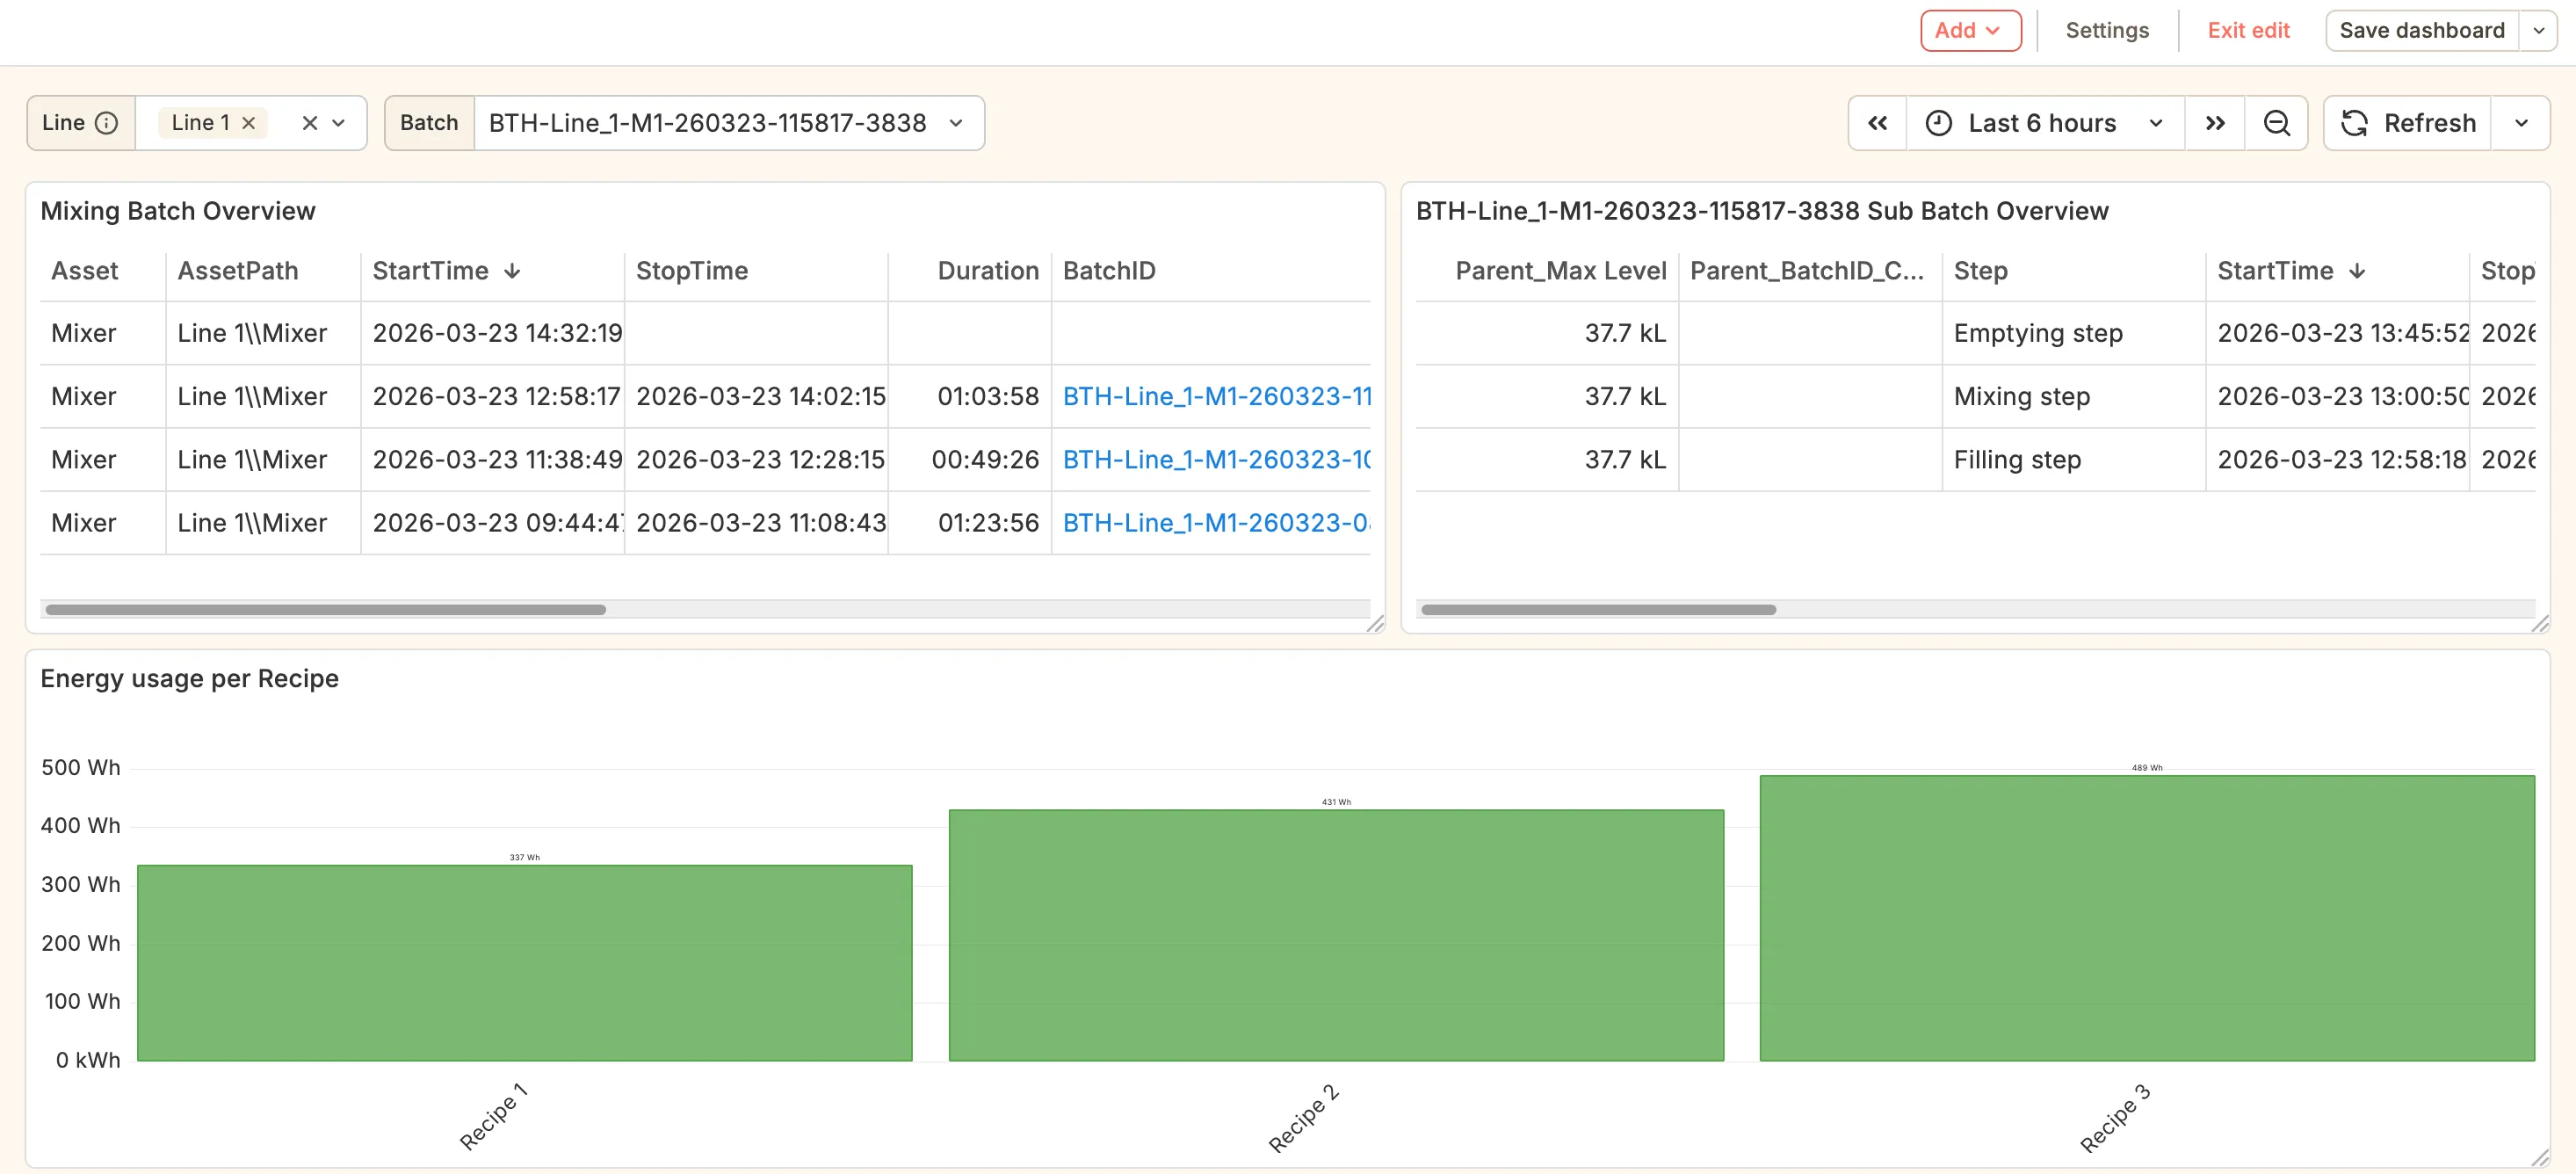
Your energy attribution dashboard should now look like this. If you click a BatchID in the Mixing Batch Overview panel, the list of subbatches on the right will populate with the 3 steps per batch.