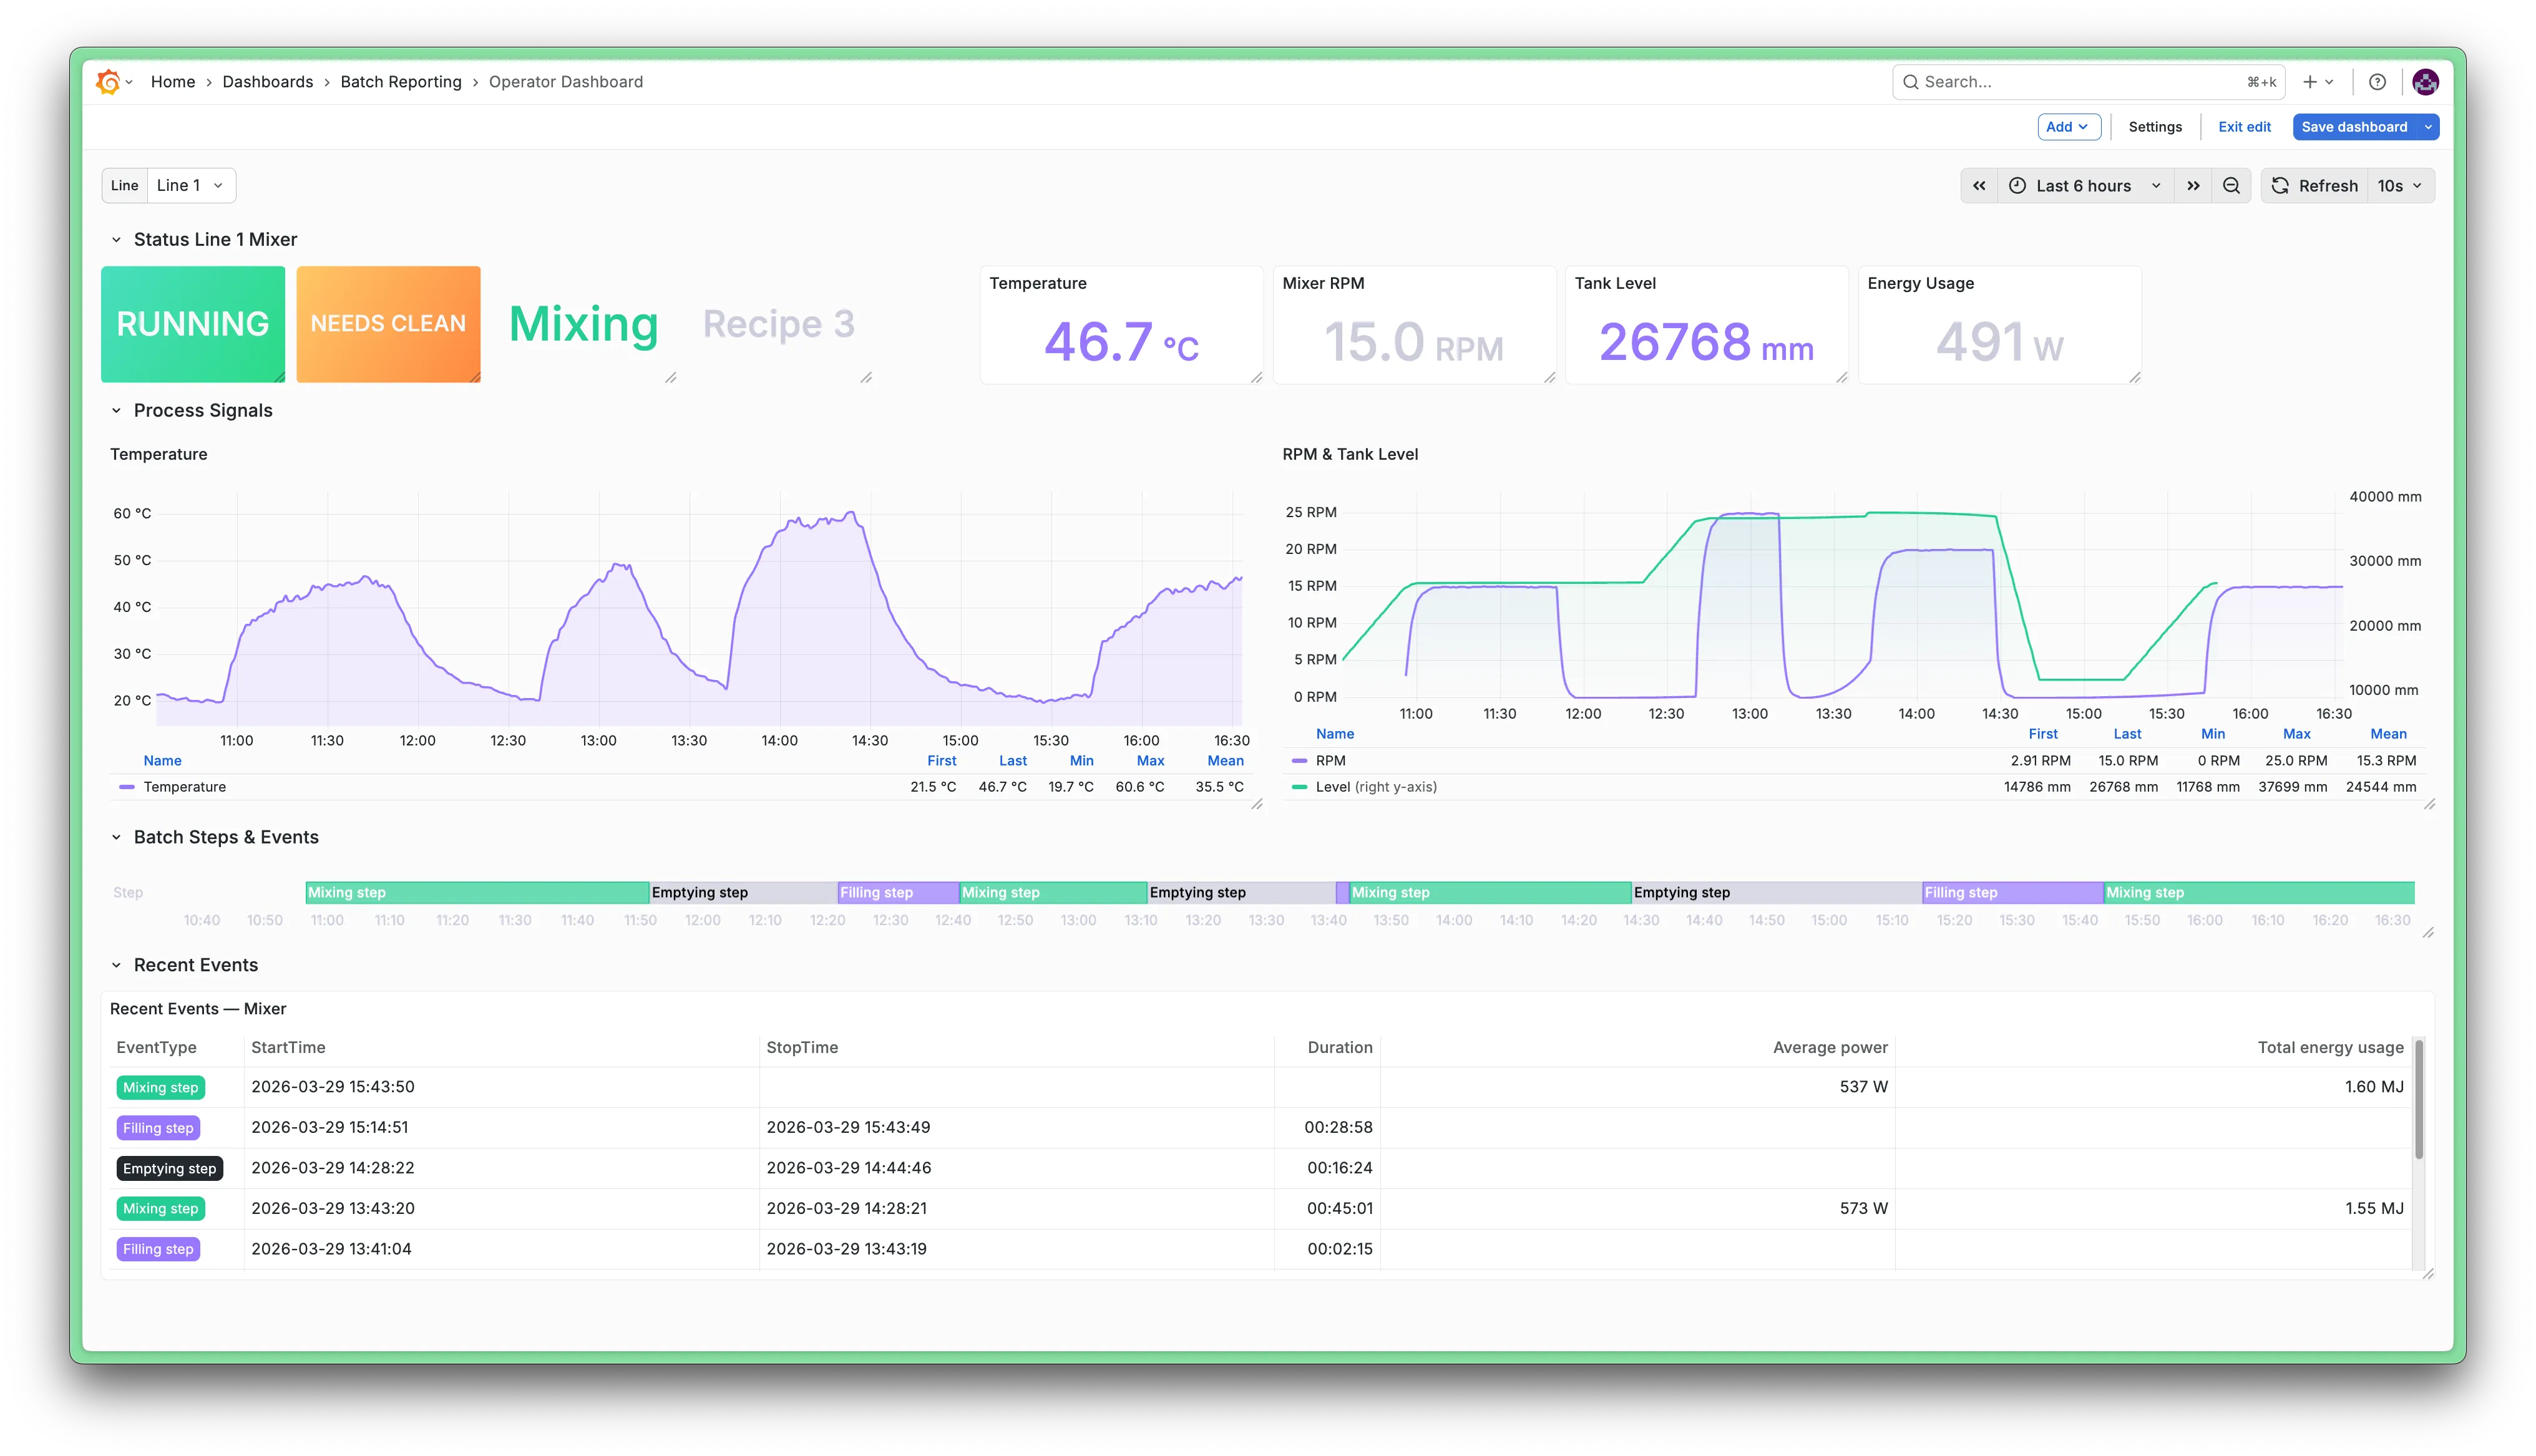
Operator dashboard
Introduction
This document describes how to set up an operator dashboard focused on batch operations. We will do so using the Faketory demo datasetFaketory demo dataset, particularly the data pertaining to the Mixing area.
Audience: Floor operators, shift leads
Purpose: Real-time awareness and immediate action
Dashboard layout
- Current status
- Realtime process trends
- Batch steps history
Step-by-step
Using Grafana variables is a great way to make a dashboard dynamic. Using theFactry Historian DatasourceFactry Historian Datasource you can populate these variables with value from Factry Historian.
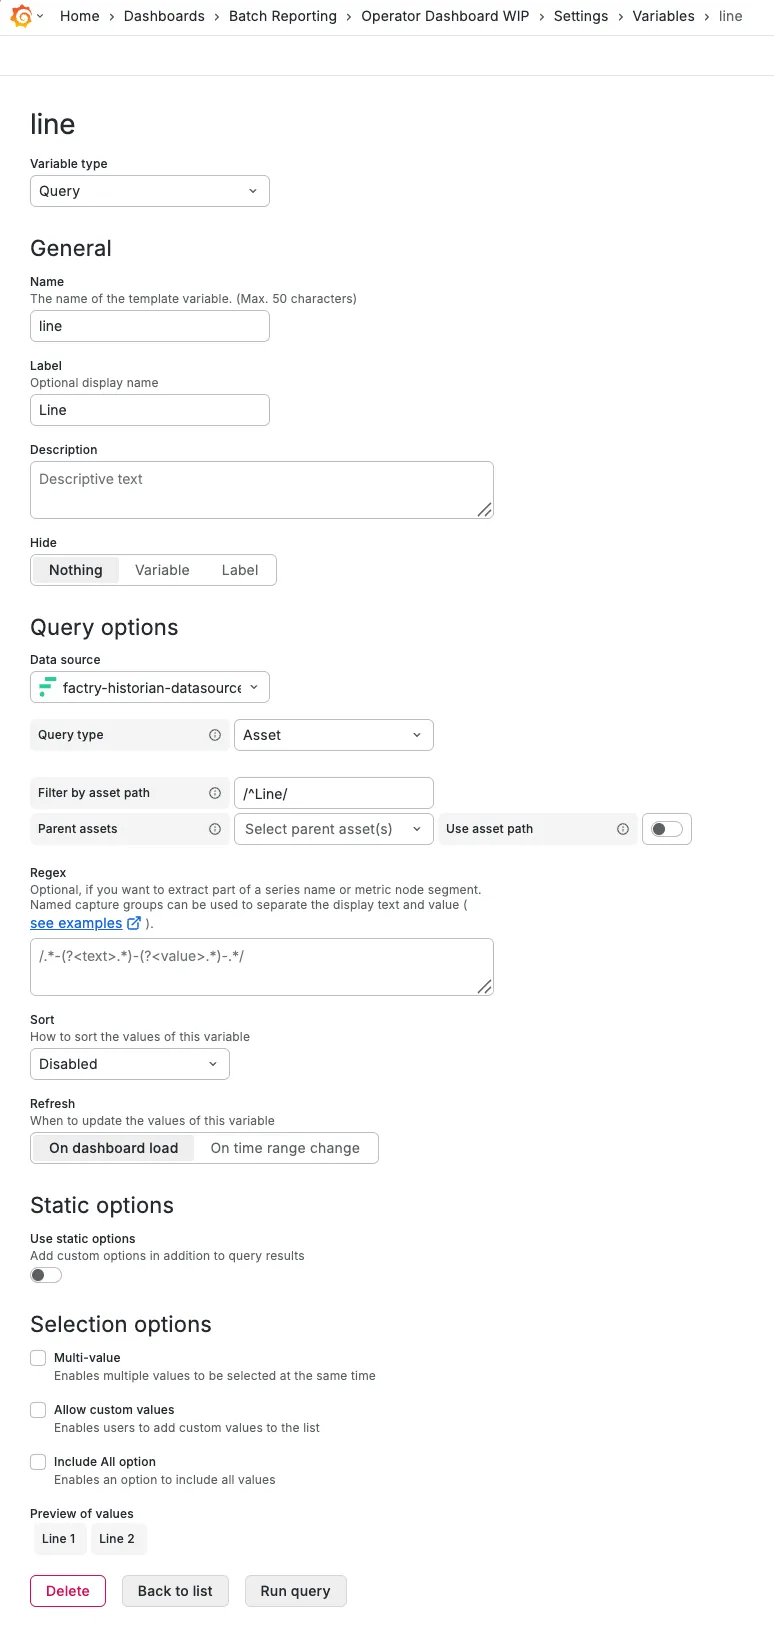
Create variable $line
There are 2 production lines in Faketory, so to make the dashboard works for both, create a variable that represents which line is currently being visualised: $line
Configure the name and label of the variable
- General
- Name: line
- Label: Line
Using lowercase for variable names is widely considered good practice.
Configure the query to populate the variable with values
- Query options
- Query Type: Asset
- Filter by asset path: /^Line/
- This regular expression search pattern matches all assets in the asset tree for which the path starts with "Line"
- Parent assets: No parent
Configure the selection options to only allow a single selection
- Selection options
- deselect 'Allow custom values'
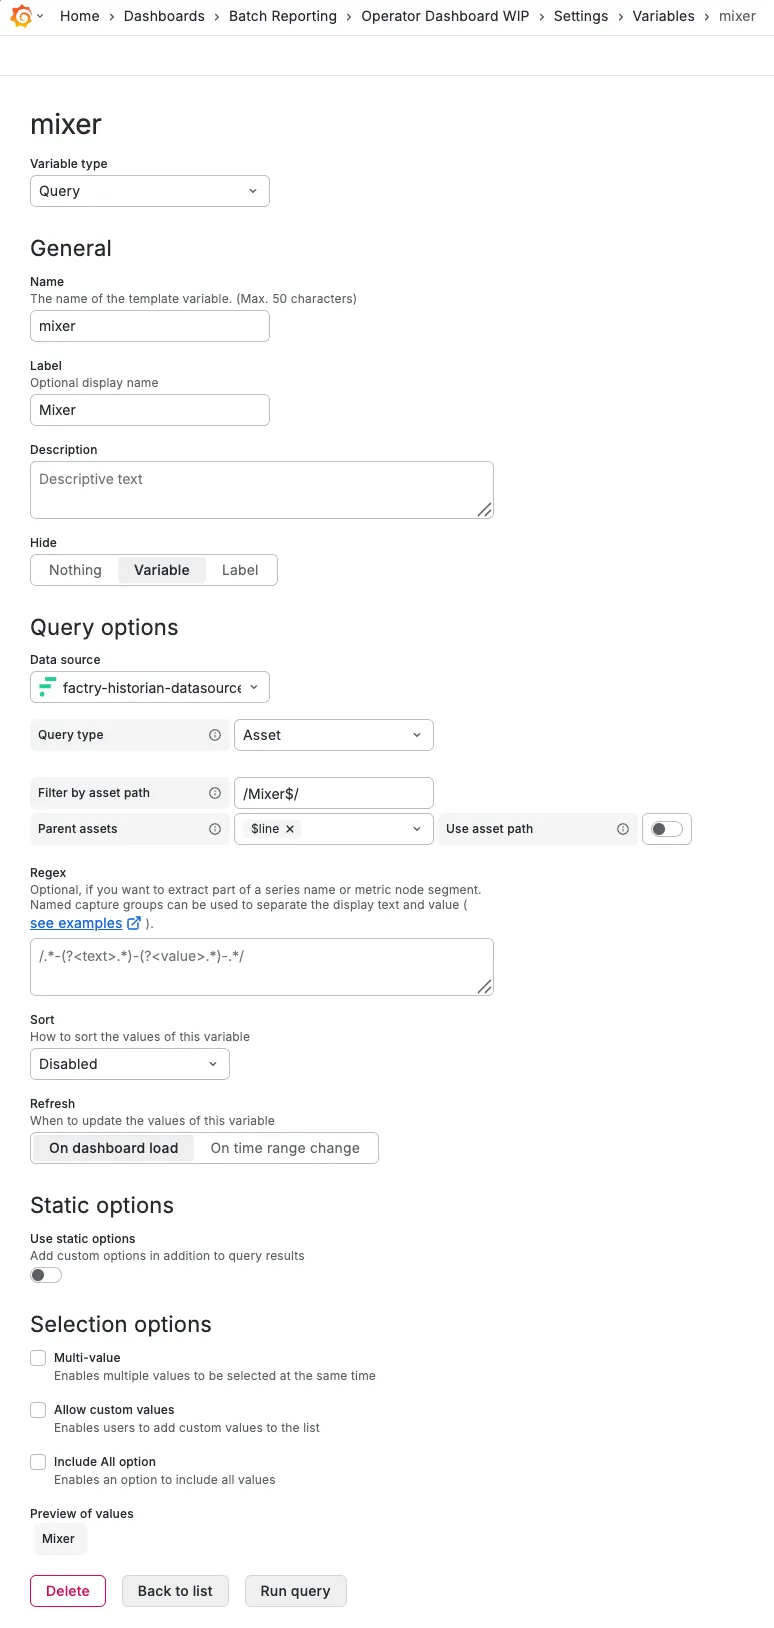
Create variable $mixer
The Line 1 and Line 2 assets do not contain any properties themselves, so create a $mixer variable as well, but hide it from the dashboard. It will automatically change to the correct Mixer asset based on the $line variable.
- General
- Name: mixer
- Label: Mixer
- Query options
- Query Type: Asset
- Filter by asset path: /Mixer$/
- Parent assets: $Line
- Selection options
- deselect 'Allow custom values'
Rows are a handy tool to organize a dashboard in specific sections that can be minimized or expanded on demand.
This row will focus on the current value of the mixer properties.
Click  > Row
Create a new row to visualize the current status of the selected mixer.
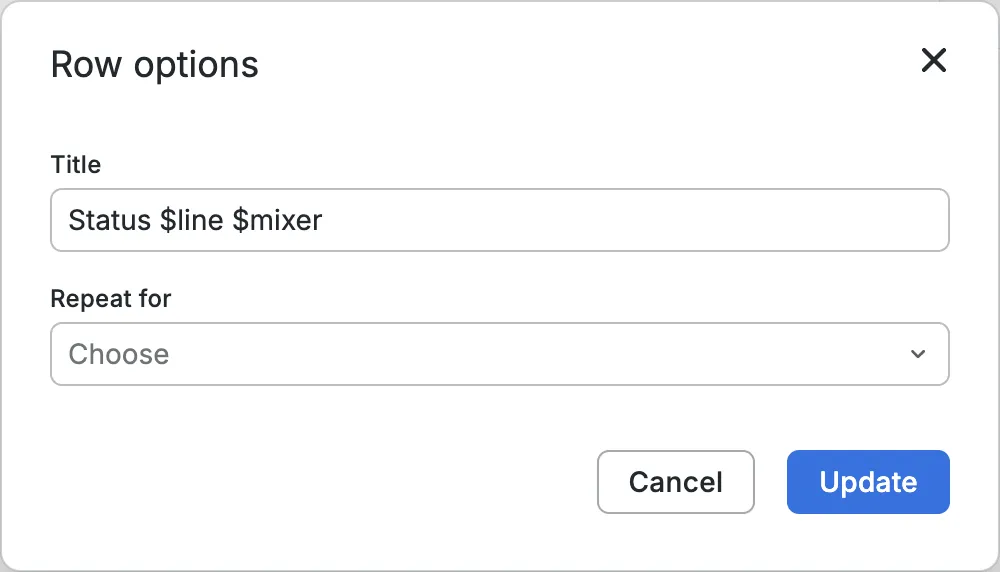
Configure the new row options
The new variables can already be tested by creating a dynamic row title: "Status $line $mixer"
Click Update
Click > Visualisation
Select Data source: Factry Historian Datasource
Configure the data source
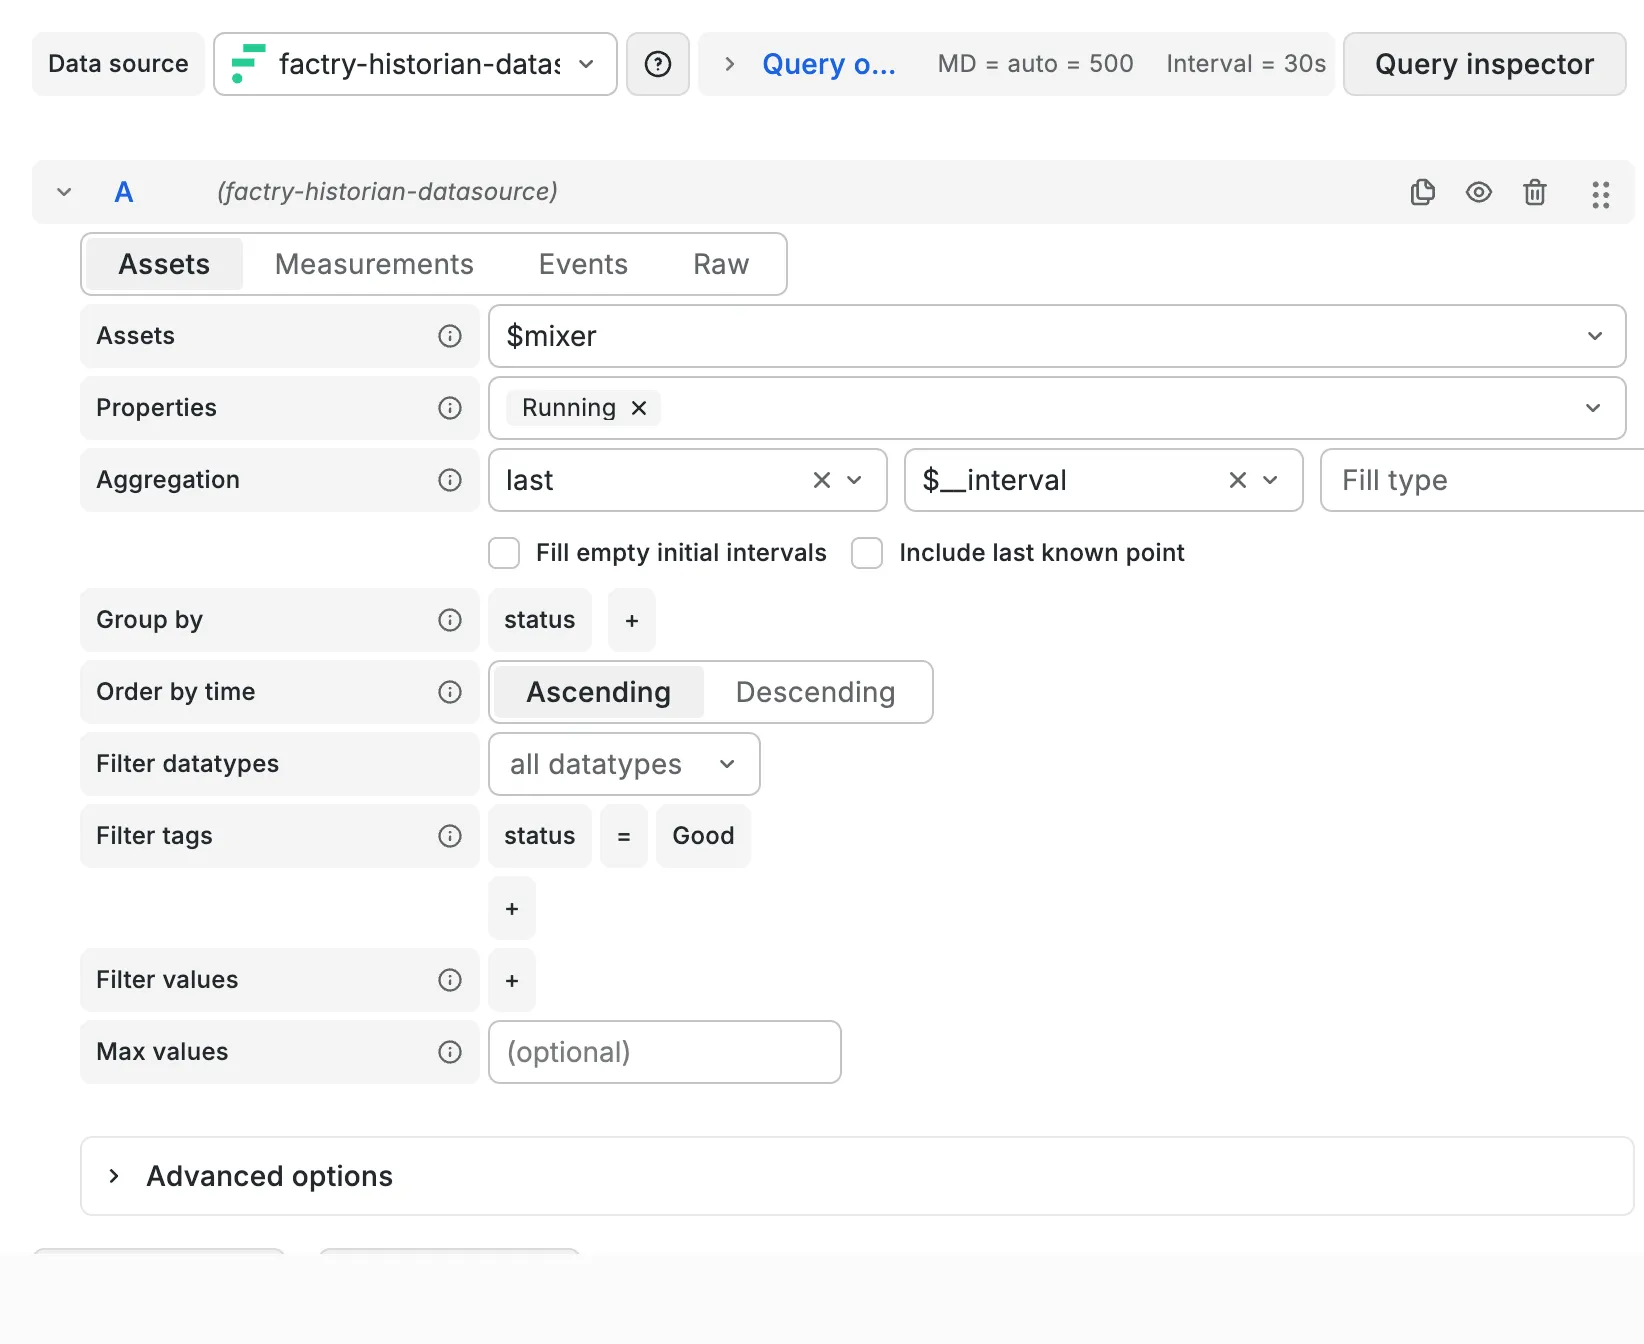
- Tab: Assets
- Assets: $mixer
- Properties: Running
- Aggregation: last
Change visualisation to Stat
In general you can use stat panels to display the last value of important properties.
Configure the stat panel options
- Panel options
- Title: (For the other properties it might make more sense to use a title. Leaving this empty makes the actual panel larger, which looks better.)
- Value options
- Fields: Line 1\\Mixer\\Running
- By default the stat panel only shows Numeric fields which do not include booleans.
- Stat styles
- Text mode: Value
- Color mode: Background Solid
- Graph mode: None
- Value mappings
- true -> RUNNING, Set color: Green
- false -> STOPPED, Set color: Red
Resize the panel
Go back to the dashboard, move the panel to the first row and resize the panel.
Save your dashboard
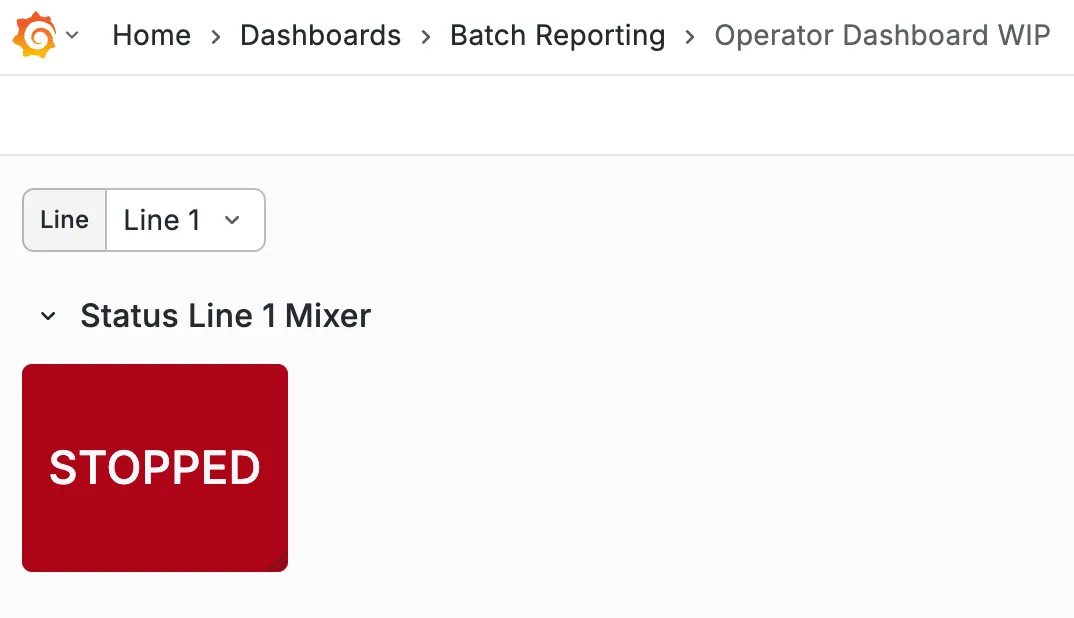
This process can be repeated for other properties and the end result could look like this screenshot below.

This row will focus on visualising the values of the mixer properties over time.
Click > Row
Configure the new row options 
Row title: Process trends
Click Update
Drag the new row to the bottom
To drag a row, it must first be collapsed.
- Click the collaps button on the left of the row title:

- Drag the row with the drag icon on the right:

- Uncollapse the row
Click > Visualisation
Select Data source: Factry Historian Datasource
Configure the data source
- Tab: Assets
- Assets: $mixer
- Properties: Temperature
Change visualisation to Time series
In general you can use time series panels to display how numeric values change over time.
Configure the panel options
- Panel options
- Title: Temperature
- Transparent background: Checked (For most visualisations, this just looks better.)
- Legend
- Mode: Table
- Values: Min Max Mean ...
- Graph styles
- Line width: 2
- Fill opacity: 10
[Optional] Change the field name This makes the legend visually cleaner.
Standard options
- Display name: ${__field.labels["AssetProperty"]}
- Add the transformation Labels to fields
- Select Labels: AssetProperty
- Value field name: AssetProperty
Resize the panel
Go back to the dashboard, drag the panel to the second row and resize the panel.
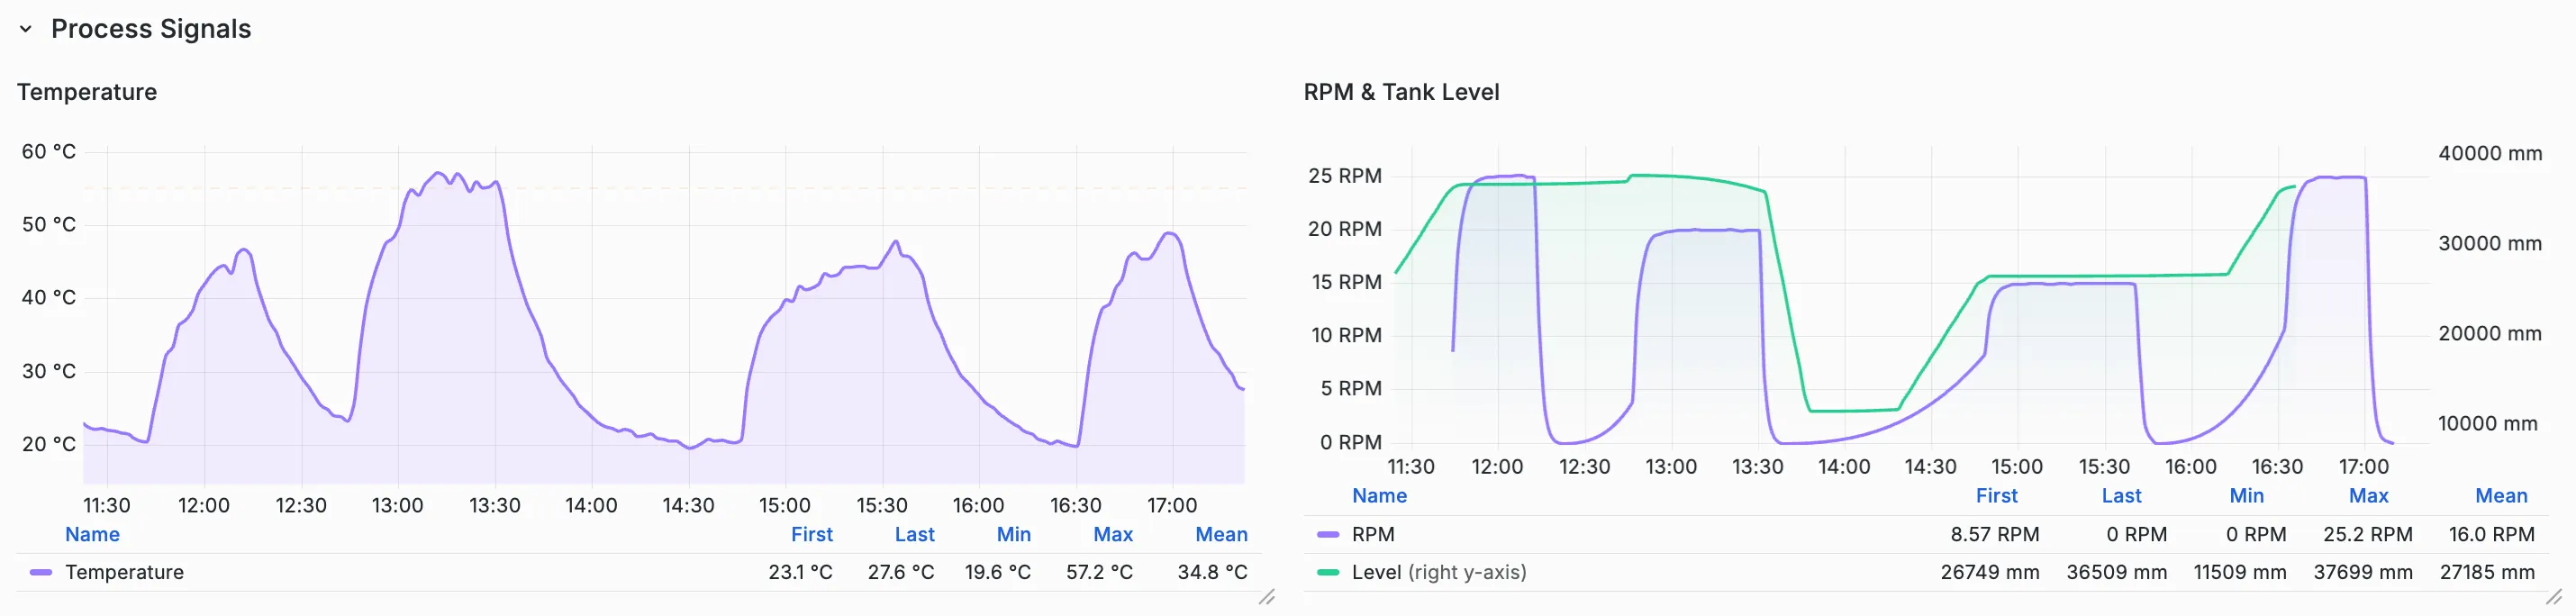
This process can be repeated for the other properties RPM and Level. In the end result could look like this screenshot below.
This row will focus on showing the latest batch steps in a table.
Click > Row
Configure the new row options
Row title: Recent events
Click Update
Drag the new row to the bottom
Click > Visualisation
Select Data source: Factry Historian Datasource
Configure the data source
- Tab: Events
- Query type: Simple
- Assets: $mixer
- Event types: Filling step Mixing step Emptying step
Add transformation Merge series/tables
The query returns a separate table for each event type by default, this transformation merges those into one.
Add transformation Filter fields by name
This transformation allows you to select the field you want and deselect the ones you don't want to see in the table by hand.
Select at least: EventType StartTime StopTime
Add transformation Sort by
After bringing the tables together with the merge transformation, the events are no longer in chronological order.
Field: StartTime
Reverse: Checked
Change visualisation to Table
In general you can use table panels to display events with their simple properties.
Configure the panel options
- Panel options
- Title:
- To color the different EventType values in different colors, there are 2 options
- Click + Add field override > Fields with name
- Fields with name: EventType
- Click + Add override property > Cell type
- Cell type: Pill (This will highlight different field values in standard different colors, which makes the event types more visually distinctive in the table.)
- Value mappings
- Click Add value mappings
- Value: Mixing step
- Display text: Leave empty
- Color: Choose color
- Repeat for Filling step and Emptying step
Placement of the panel
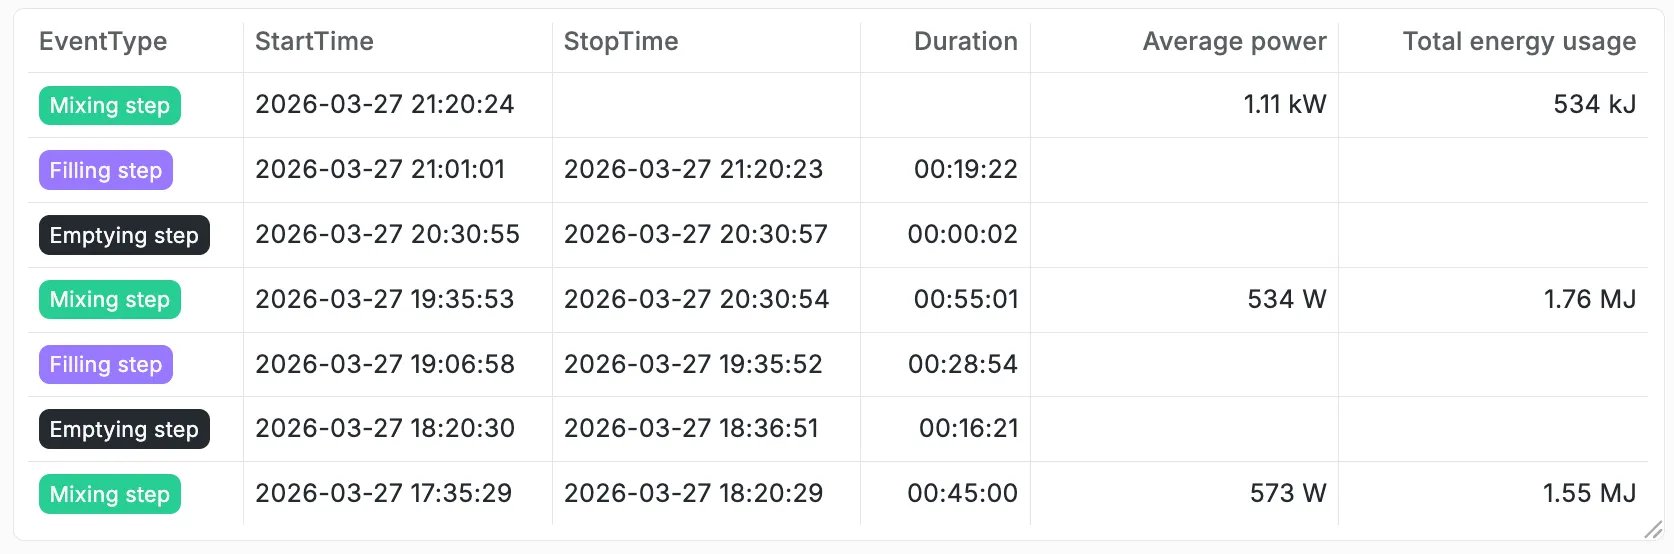
Go back to the dashboard, drag the panel to the correct row and resize.
Click > Visualisation
Select Data source: Dashboard
Since the event data was already queried by the previously created table panel, we can re-used that dataset and the transformations for this new panel.
Source panel: pick the correct panel
Transform: Checked
Change visualisation to State timeline
In general you can use state timeline panels to display how the state of something changes over time. This panel type can also interpret a second timestamp to indicate the end of the 'state'.
Configure the panel options
- Panel options
- Title:
- Transparent background: Checked
- Legend
- Visibility: Unchecked
- Value mappings
- Click Add value mappings
- Value: Mixing step
- Display text: Leave empty
- Color: Choose color (Best to use the same colors as the previous panel.)
- Repeat for Filling step and Emptying step
Resize the panel
Go back to the dashboard, drag the panel to the second row and resize the panel.
End result
The end result should look like something like this screenshot below.